Failure rates in phishing simulations range from 1.8% to 30.8% depending on the lure. So what does a repeat-clicker list measure, and what can you do with it?


Failure rates in phishing simulations range from 1.8% to 30.8% depending on the lure. So what does a repeat-clicker list measure, and what can you do with it?

Targeted plans cover the areas with a risk hypothesis. What coverage is left for the rest of the organization, and which indicator you can actually report.
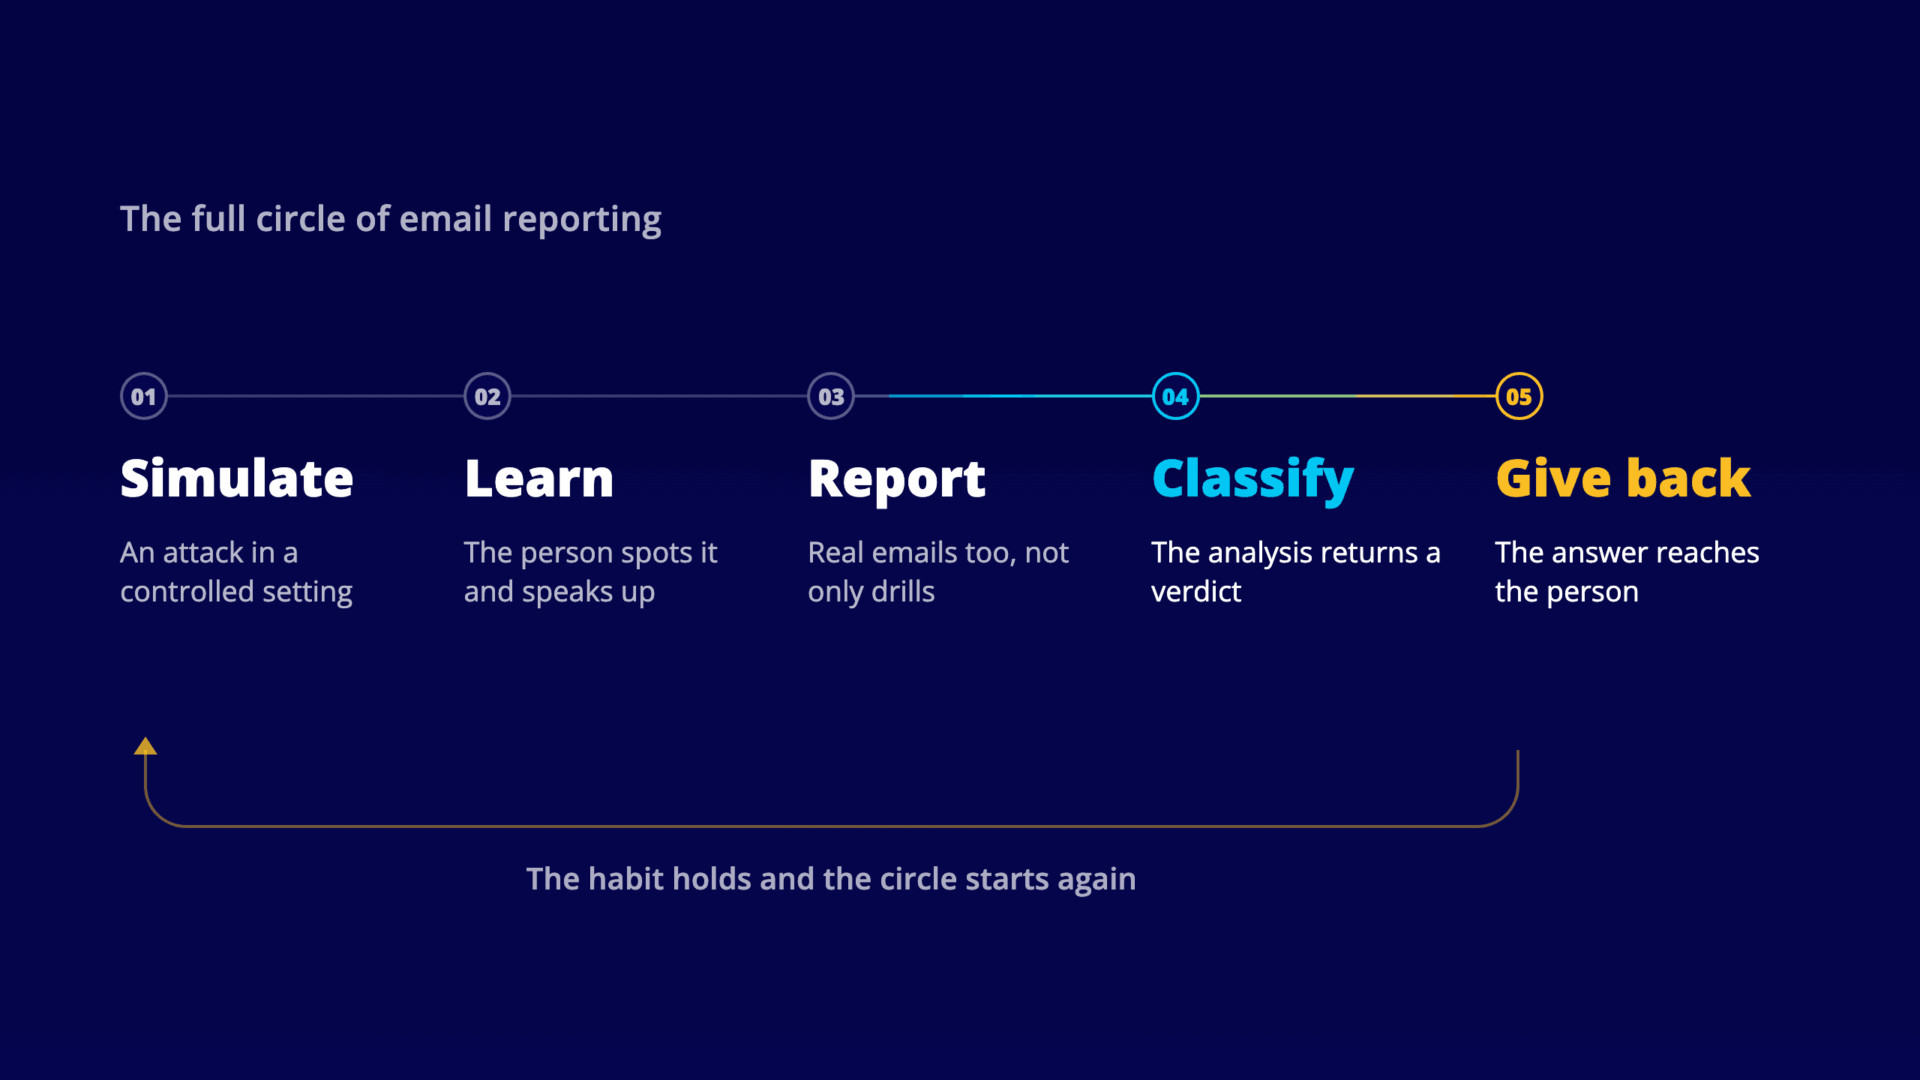
Which phishing reporting metrics program owners watch, how the report gets back to the person who sent it, and the two numbers that answer the board.

Self-efficacy predicts secure behavior better than knowledge does, and no awareness dashboard tracks it. What the evidence says and what a program can decide.

Phishing report volume grows with your awareness program, and so does the triage queue. What it costs when a real attack waits its turn.
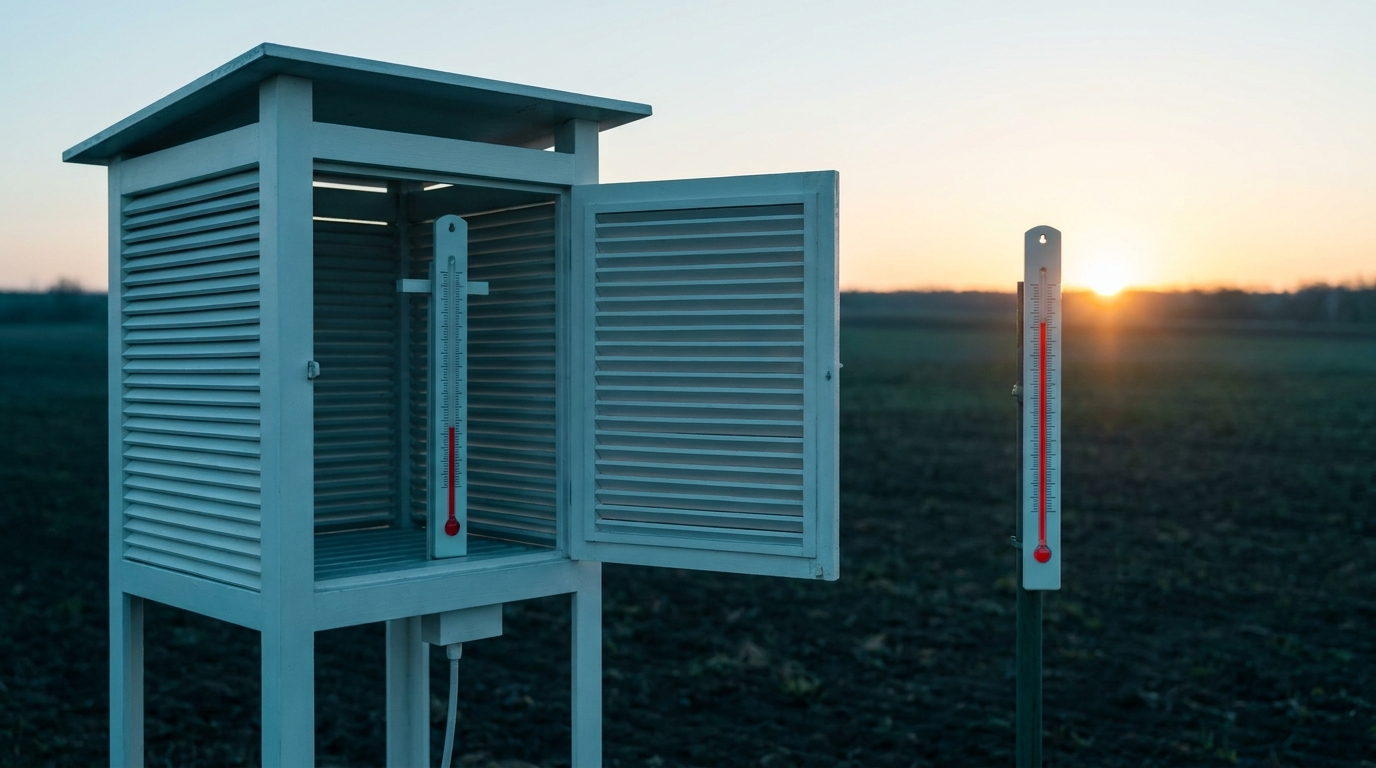
Phishing simulation delivery and the tracking pixel decide how much of your click rate measures people and how much of it measures your own environment.

How the SMARTFENSE demo works end-to-end: what’s configured, which metrics get measured, and what your organization walks away with when it’s done.

The best security awareness platforms aren’t chosen by feature matrix. A decision framework with five questions, objective criteria and a useful PoC for CISOs.